Sales capacity planning is one of those decisions that quietly shapes everything else (hiring pace, territory load, forecast confidence).
Get it roughly right and the year feels manageable.
Get it slightly wrong and every quarter turns reactive.
The challenge isn’t building a model, but building one that holds up once ramp, coverage, and real execution show up.
We’ll break down how to plan sales capacity in a way that supports growth, step by step.
Key Notes
- Sales capacity planning ties revenue targets to real rep yield, ramp time, and attrition.
- Capacity models fail without explicit assumptions, segment-level inputs, and ownership.
- Hybrid capacity modeling balances top-down targets with bottom-up execution constraints.
- Capacity plans must be revisited quarterly using execution signals.
The Core Capacity Formula
At the heart of sales capacity planning is a simple idea:
Sales capacity = sellers × yield
The complexity is not the formula. It’s the assumptions.
The Base Capacity Formula
Sales capacity (bookings) = Number of reps × Productivity per rep
Where productivity per rep is not quota. It’s expected output based on attainment and reality.
The Executive “Required Reps” Formula (Useful For Headcount Math)
This is the capacity formula variant that shows up most in planning:
Required reps = Revenue target ÷ (Average quota × Expected attainment%)
If you skip attainment, you will under-hire and then blame execution.
Adding Ramp (The Part Most Teams Gloss Over)
In practice, you rarely have “N reps.” You have a mix of:
- fully productive reps
- partially ramped reps
- brand-new reps
A practical way to model this:
Fully ramped rep equivalents (FREs)
You convert each rep into a fraction of a fully ramped rep based on their month-in-role.
Example ramp curve (illustrative):
- Months 1–2: 0%
- Months 3–4: 25%
- Months 5–6: 50%
- Months 7–9: 75%
- Months 10–12: 100%
Then:
Expected bookings = FREs × Fully ramped productivity
Not perfect, but way more honest than pretending a Q3 hire is a full-year contributor.
What Moves The Model Most?
If you need to pick where to spend time validating inputs, it’s usually these:
- Yield per rep by segment
- Ramp curve assumptions
- Attrition and backfill lag
- Win rate and cycle time (because they govern pipeline needs)
Everything else is noise compared to those.
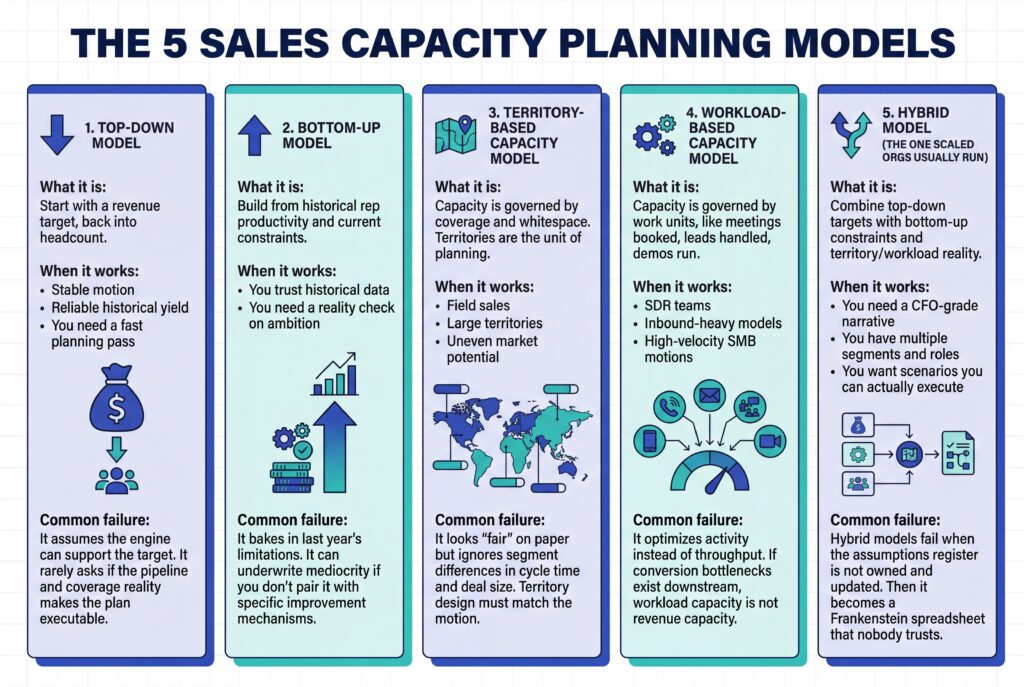
The 5 Sales Capacity Planning Models (& When Each One Fails)
A sales capacity planning model is really just a lens. The mistake is picking one lens and treating it as the truth.
Sales Capacity Planning Step By Step
Here is a best-practice capacity modeling process you can run without turning it into a six-week exercise.
Step 1: Align On The Target & The Definitions
Before you crunch numbers, lock:
- What counts as revenue (net new, expansion, gross)
- Target by segment (or at least by motion)
- Role definitions (AE vs AM vs CS)
- The unit of planning (bookings, ARR, pipeline)
Deliverable: One-page definitions doc. No wiggle room.
Step 2: Calculate Current Capacity (Baseline)
You want to answer one question: If we change nothing, what happens?
Build a baseline table:
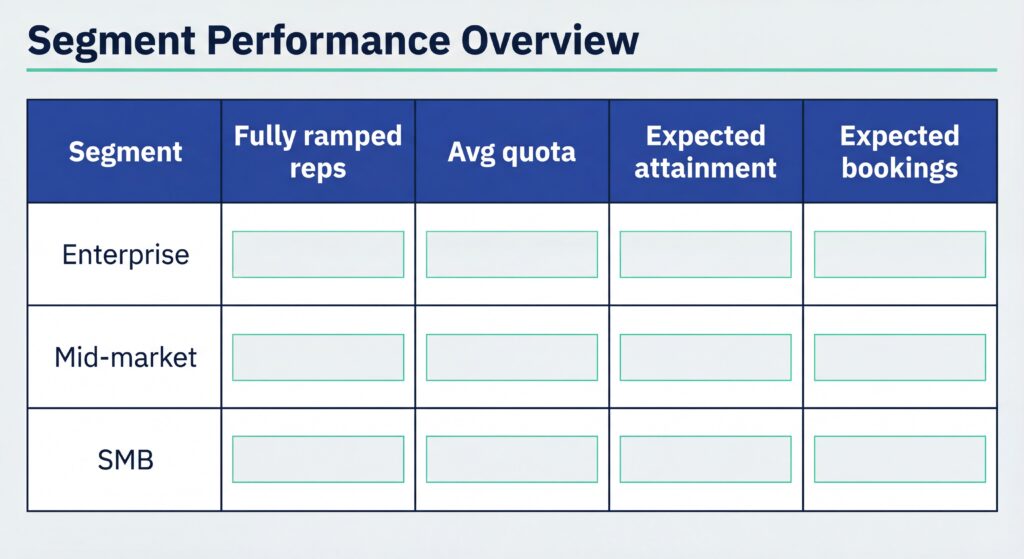
This is where most teams learn something uncomfortable. Good.
Deliverable: Baseline capacity table by segment.
Step 3: Lock Assumptions & Ratios (With Sources)
This is the part to treat like due diligence.
For each assumption, capture:
- the number
- the source (CRM, finance, call data, comp plan)
- the owner
- the confidence level
Assumptions register (template):
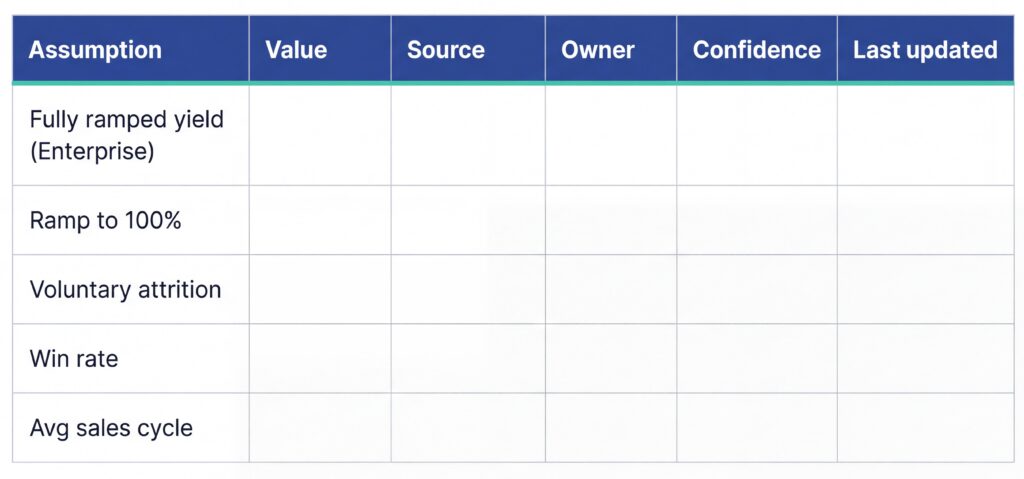
The goal is not perfection. The goal is explicitness.
Deliverable: Assumptions register with owners.
Step 4: Compute The Capacity Gap
Now compare baseline capacity to target.
- Target bookings by segment
- Expected bookings from current team
- Gap
If your plan treats all gaps as “hire more AEs,” you’re about to create imbalance.
Sometimes the correct answer is:
- fix conversion in stage 2–3
- redesign territories
- adjust SDR to AE ratio
- change comp levers to reduce churn
Capacity modeling is where those choices become visible.
Deliverable: Capacity gap table and what could close it.
Step 5: Build Scenarios, Then Choose An Investment Path
This is the operator move.
Build three scenarios:
- Conservative: Protect downside, slower hiring, higher focus on efficiency
- Base: realistic Growth, balanced hiring and enablement
- Aggressive: Pull growth forward, heavier early hiring, higher risk
For each scenario, specify what changes:
- hire timing
- yield improvements (and why you believe them)
- pipeline requirements
- spend impact
Deliverable: Scenario matrix with tradeoffs.
Step 6: Turn The Chosen Scenario Into A Hiring Plan With Timing
Hiring timing is not a footnote. It is the plan.
Include:
- Approved hires by quarter
- Expected start dates (using real recruiting lead times)
- Ramp curve by hire cohort
- Manager capacity and onboarding bandwidth
Deliverable: Hiring plan that produces a quarterly bookings plan.
Role-based Capacity Planning (So You Don’t Build A Lopsided Engine)
A sales org is a system. Capacity is rarely constrained in only one place.
SDR Capacity
If SDR output feeds AEs, your model needs a simple intake check.
Ask:
- How many qualified opportunities does an AE need per period to hit their number?
- Can SDRs produce that volume at current conversion rates?
If not, you do not have an AE capacity problem. You have an SDR throughput problem.
AE Capacity
AE capacity is governed by:
- deal volume and cycle time
- territory potential
- internal friction (approvals, legal cycles)
If cycle time increases by 20%, capacity drops even if headcount stays flat. Most models ignore that.
CS & Expansion Capacity
If expansion is part of the target, capacity planning must include:
- renewal workload
- expansion triggers
- health scoring inputs
Otherwise, you’ll forecast expansion that nobody has time to create.
Manager Capacity (The Hidden Bottleneck)
Teams forget this until it hurts.
New hires do not ramp themselves. If you expand the team without expanding coaching capacity, ramp slows. Yield assumptions break. Attrition creeps up.
Manager bandwidth is capacity.
Operating Cadence: How Often To Re-Plan & What Triggers An Update
An annual model is a starting point.
A living model is an operating system.
Minimum Cadence
- Quarterly re-plan: Update assumptions, refresh scenario table, re-align hiring pace
- Monthly check: Monitor the leading indicators that tell you if capacity is holding
Trigger-Based Updates (When You Should Re-Run Immediately)
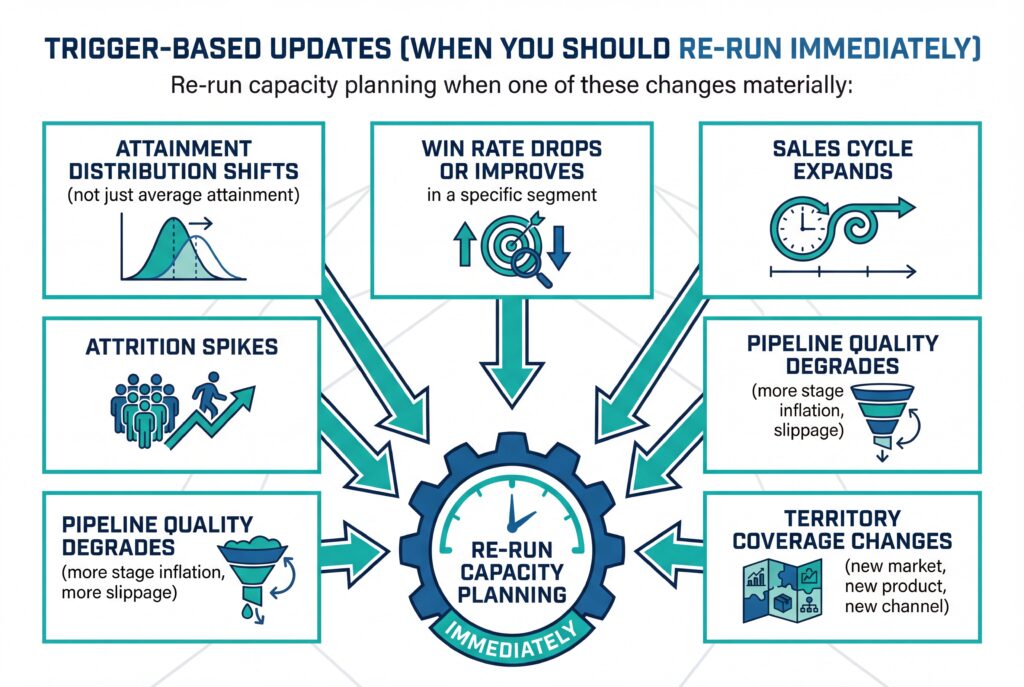
The point is not to change the plan constantly.
The point is to make course corrections at the speed the business requires.
Practical Governance
If you want this to work across a portfolio or a scaling company, assign:
- who owns the assumptions register
- who owns scenario refresh
- who has decision rights on hiring pace
No owner, no plan. Simple.
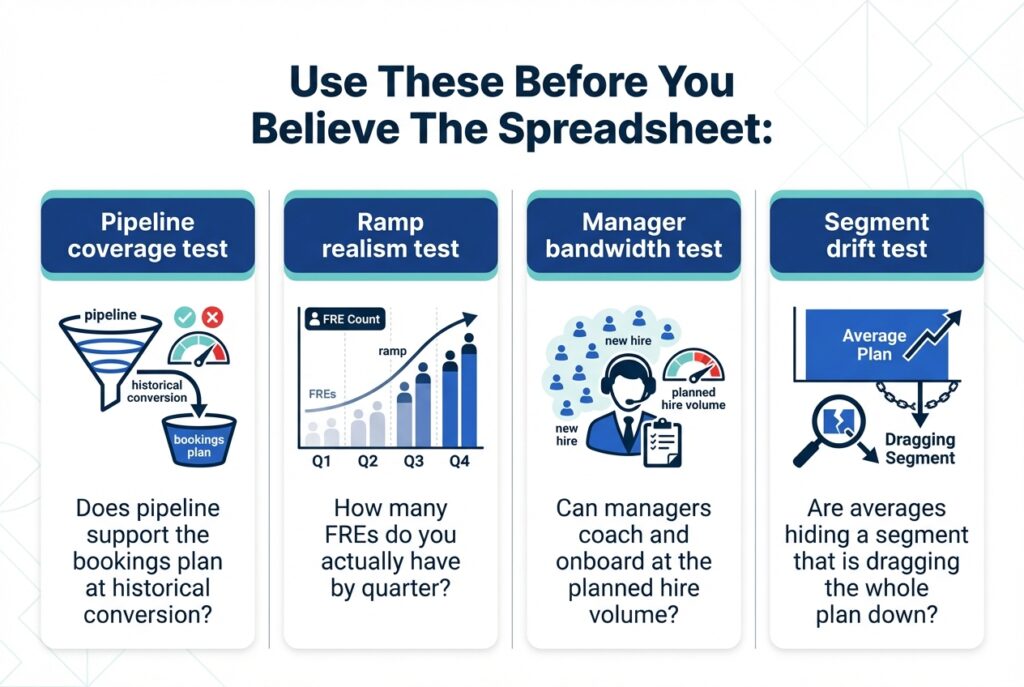
Common Mistakes & The Sanity Checks That Catch Them
Here are the patterns that show up again and again.
Mistake: Treating Quota As Capacity
Quota is a target.
Capacity is expected output.
If your model assumes 100% attainment across the board, it’s not a model. It’s a motivational poster.
Mistake: Planning Ramp As A Straight Line
Ramp is lumpy – people leave, territories take time to learn, and some segments have long proof cycles.
Model cohorts. Use FREs. Anything is better than pretending every hire contributes equally.
Mistake: Ignoring Backfill Lag
Attrition does not just remove a rep. It removes a rep and creates a time gap where capacity produces nothing, then produces less while the replacement ramps.
Mistake: Ignoring Process Bottlenecks
Capacity is not only headcount.
It’s also:
- SDR to AE handoffs
- pricing approvals
- legal turnaround
- product limitations
A bottleneck at the end of the funnel can make you look under-capacity even if you hired perfectly.
Sanity Checks (Quick Tests)
Implementation Roadmap
You can put this in motion fast if you avoid over-engineering.
Week 1: Baseline & Definitions
- Lock definitions
- Build baseline capacity by segment
- Create assumptions register with owners
Week 2: Model & Scenarios
- Build the capacity model (choose your primary lens)
- Create conservative, base, aggressive scenarios
- Pressure-test yield and ramp assumptions
Week 3: Hiring Plan & Constraints
- Convert scenario to quarterly hiring plan
- Model ramp cohorts (FREs)
- Confirm manager bandwidth and recruiting capacity
Week 4: Cadence And Governance
- Set quarterly re-plan cadence
- Define trigger-based updates
- Create a single operating view for leadership
At that point, the plan can survive contact with reality.
Frequently Asked Questions
What is a sales capacity planning model?
A sales capacity planning model is the structure used to translate revenue targets into required selling capacity. It defines how headcount, ramp time, attainment, and productivity interact, so growth decisions are based on math, not hope.
How is salesforce capacity planning different from quota planning?
Salesforce capacity planning focuses on how much revenue your team can actually produce given constraints like ramp, coverage, and conversion. Quota planning sets targets. Capacity planning determines whether those targets are achievable.
What’s the difference between capacity modeling and forecasting?
Capacity modeling defines what could be produced with a given team and plan. Forecasting estimates what will be produced based on in-quarter execution. One sets the ceiling. The other tracks progress against it.
What capacity formula do sales leaders use most often?
The most common capacity formula is revenue target divided by expected output per fully ramped rep. Leaders adjust it using attainment, ramp timing, and attrition to reflect real-world selling conditions.
Conclusion
Sales capacity planning decides whether growth is intentional or accidental. It forces clarity on what a team can realistically produce, when that production shows up, and what breaks if assumptions drift.
The strongest plans anchor on yield by segment, realistic ramp curves, and clear ownership of the inputs that matter. They surface tradeoffs early. Hire now or later. Fix coverage or fix conversion. Push volume or protect quality.
When capacity is modeled this way, planning stops being theoretical and starts guiding real decisions across the year.
EnableU lets you apply that same discipline to your own numbers, using real ramp, yield, and execution signals instead of static assumptions. Start a free trial to see where your plan holds and where it quietly breaks.
Leave a Reply