Sales analytics has a reputation problem – everyone has dashboards but few people trust them. Fewer still use them to change what happens in real deals.
Somewhere between CRM reports, spreadsheets, and “gut feel,” the signal gets lost. The result is plenty of data and very little clarity.
We’ll break down how sales analytics works, which metrics matter, how to turn data into action, and how leading teams use analytics to drive execution while deals are still live.
Key Notes
- Sales analytics only works when metrics are tied to decisions, coaching, and clear owners.
- Leading indicators reveal deal risk and execution gaps earlier than lagging outcomes.
- Analytics compounds value when embedded into weekly pipeline, coaching, and planning cadences.
What Is Sales Analytics?
Sales analytics is the discipline of turning raw sales data into actionable insight that improves revenue outcomes.
That sentence matters because it sets a boundary.
- If you are collecting data but no decision changes, you do not have analytics. You have reporting.
- If you are looking at dashboards but managers coach the same way they always have, you do not have analytics. You have busywork.
When Does “Reporting” Become “Analytics”?
Reporting tells you what happened.
Analytics tells you:
- Why it happened (diagnosis)
- What is likely to happen next (prediction)
- What to do about it (action)
A simple rule: If the output does not change a decision, it is trivia.
Misconceptions Leaders Have About Sales Analytics
Misconception 1: Analytics is a tool category.
Tools help, but analytics is a system:
- Definitions
- Governance
- Metrics
- Cadence
- Accountability
A new BI dashboard does not fix a sales org that cannot agree on what “qualified” means.
Misconception 2: More metrics means more control.
Most orgs drown in metrics and still miss the obvious. The problem is not volume, but relevance. Great analytics is selective.
Misconception 3: Data-driven means objective.
Sales data is shaped by incentives. If stage progression is tied to rep comp or manager optics, the data will bend. Analytics must account for that reality.
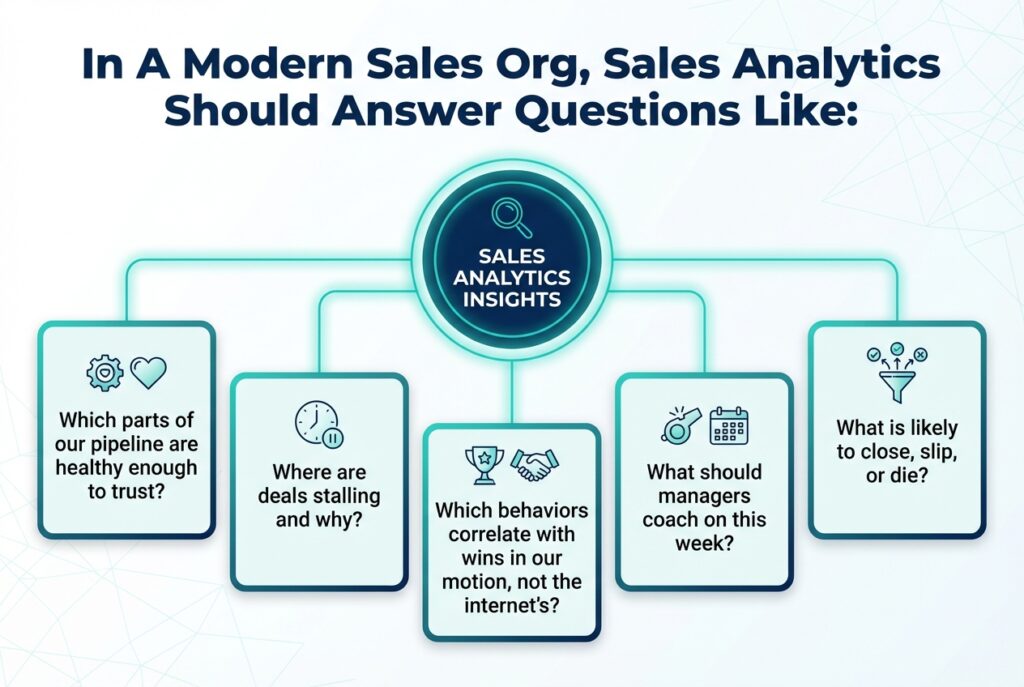
The Sales Analytics Questions That Move Revenue
Sales analytics gets messy when it starts with metrics. Start with decisions instead. Here are the five question categories that cover the space:
1) Growth: Where Will Revenue Come From Next?
- Which segments are expanding or shrinking?
- Which sources and motions are producing deals that close?
- Where are we over-investing in low-return pipeline?
2) Conversion: Where Do Deals Leak & Why?
- Which stage transitions drop off hardest?
- Does win rate change materially by segment, deal size, or competitor?
- Are we losing on product fit, pricing, decision process, or execution quality?
3) Velocity: What Is Slowing Deals Down?
- Where does time-in-stage spike?
- What causes slippage? Missing stakeholders, unclear next steps, weak proof points?
- Which deal types are predictably slow and should be treated differently?
4) Productivity: What Are Reps Doing That Correlates With Wins?
- Which activities are noise and which are leading indicators?
- How does rep tenure change output and conversion?
- Where is manager time being spent, and is it creating lift?
5) Risk: Which Deals & Forecasts Are Least Trustworthy?
- Which deals are “green” in stage but red in behavior?
- Where do close dates drift and why?
- Which segments consistently under-forecast or over-forecast?
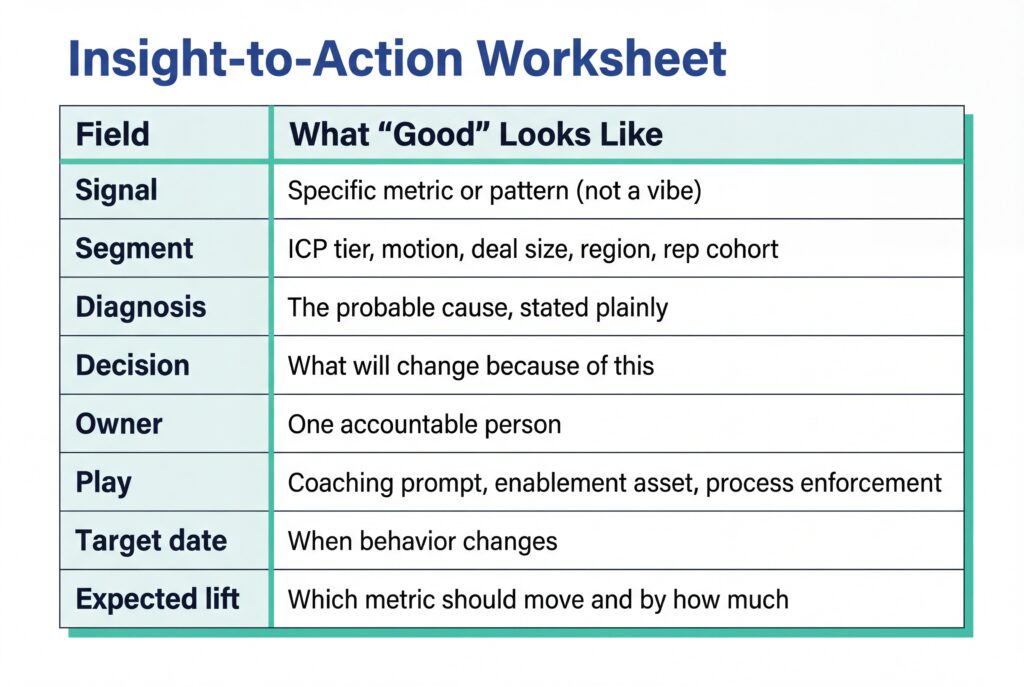
The Action Chain
Analytics is only valuable when it connects to a behavior change loop:
Insight → Decision → Coaching or play → Rep action → Measurable shift
If you cannot name the next play, you have a slide instead of an operating system.
Here’s an easy template you can use:
Data Foundations You Need Before Any Metric Matters
The fastest way to kill trust in sales analytics is to make it feel arbitrary. Leaders stop believing the numbers. Reps stop updating fields. Managers go back to gut.
The fix is better instrumentation.
Data Sources That Matter Most
Sales analytics is multi-source by default. CRM alone rarely captures the full picture.
| Source | What It’s Good For | Where It Usually Fails |
| CRM | Stages, amounts, owners, dates | Inconsistent definitions, stage gaming |
| Sales engagement | Activity volume, sequence performance | Activity quality is hard to infer |
| Call intelligence | Buyer signals, topics, next steps | Needs structured tagging to be usable |
| Product and billing | Expansion, retention, usage | Often disconnected from pipeline reality |
| Support and CS tools | Risk signals, adoption blockers | Not mapped to revenue decisions |
Definitions That Prevent Chaos
If you want analytics that leaders trust, you need definitions that people cannot reinterpret mid-quarter.
Standardize:
- Stage entry criteria (what must be true to enter)
- Stage exit criteria (what must be observed to progress)
- Close date rules (who can change it, when, and why)
- Qualified opportunity definition (tight enough to protect the funnel)
- Activity taxonomy (what counts as meaningful activity)
A strong sign you need this work: two leaders can look at the same pipeline and tell different stories.
Hygiene Rules And Governance
Governance sounds boring until you have to explain a forecast miss to the board.
Set three things:
- Required fields by stage (hard gates where possible)
- Data SLAs (freshness expectations, like “updates within 24 hours of buyer interaction”)
- Exception handling (what happens when deals do not fit the standard path)
This is where sales analytics becomes real – not perfect, but reliable.
Sales Analytics Metrics Leaders Should Standardize
Build A Metric Tree
A practical tree connects outcomes to drivers to behaviors. Revenue is the lagging outcome. Most leaders live here.
But revenue is produced by drivers:
- Pipeline coverage
- Win rate
- Average selling price (ASP)
- Velocity
Each driver has controllable inputs.
Here is a simplified tree you can steal:
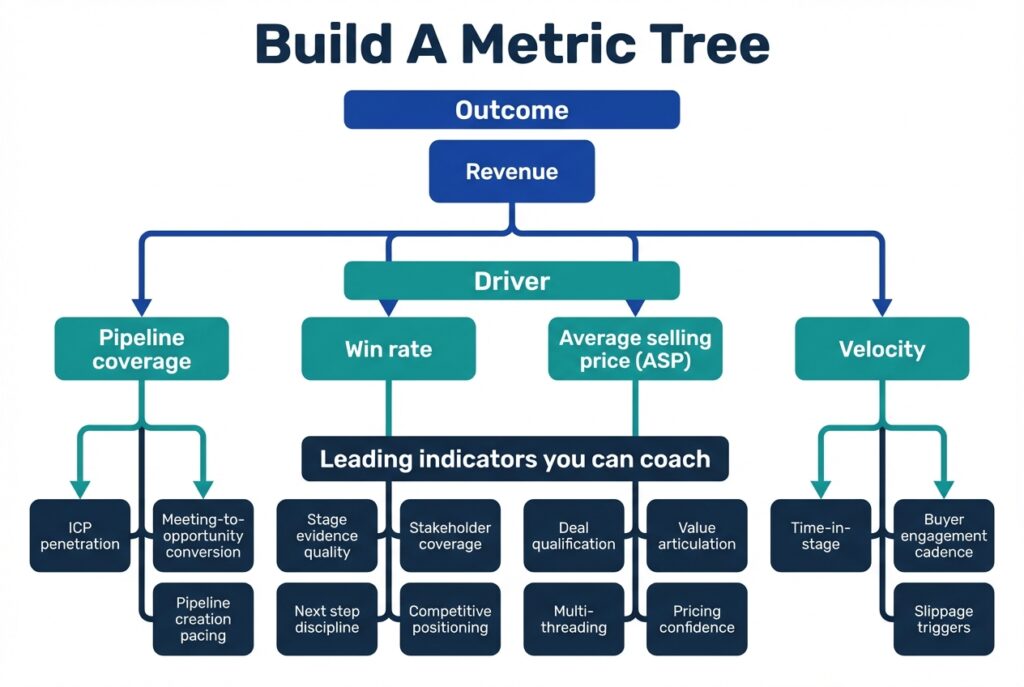
The point is not perfection. It is alignment.
The Core Metric Set (5 Buckets)
1) Pipeline Health
- Pipeline coverage by segment and rep
- Stage distribution
- Pipeline aging and time-in-stage
- New pipeline creation pacing
2) Conversion
- Stage-to-stage conversion rates
- Win rate by segment, motion, deal size
- Loss reasons with evidence, not opinions
3) Velocity
- Cycle length by segment
- Time in stage
- Days since last meaningful buyer step
4) Productivity
- Meetings created per rep and cohort
- Opportunities created per rep
- Activities that correlate with progression (quality weighted)
- Ramp progress by role and tenure
5) Forecast Integrity
- Forecast accuracy over time
- Slip rate (forecasted to close but moves)
- Commit hygiene (what “commit” actually means in your org)
- Deal risk signals compared to stage
Leading vs Lagging Indicators
Lagging metrics are necessary. They are also late.
Leading indicators are useful when they are tied to behavior and verified in reality. A clean example:
- Lagging: win rate
- Leading: stakeholder coverage, next step quality, time-in-stage drift, buyer engagement signals
If your leading indicators are just activity volume, you will build a busy sales team, not a winning one.
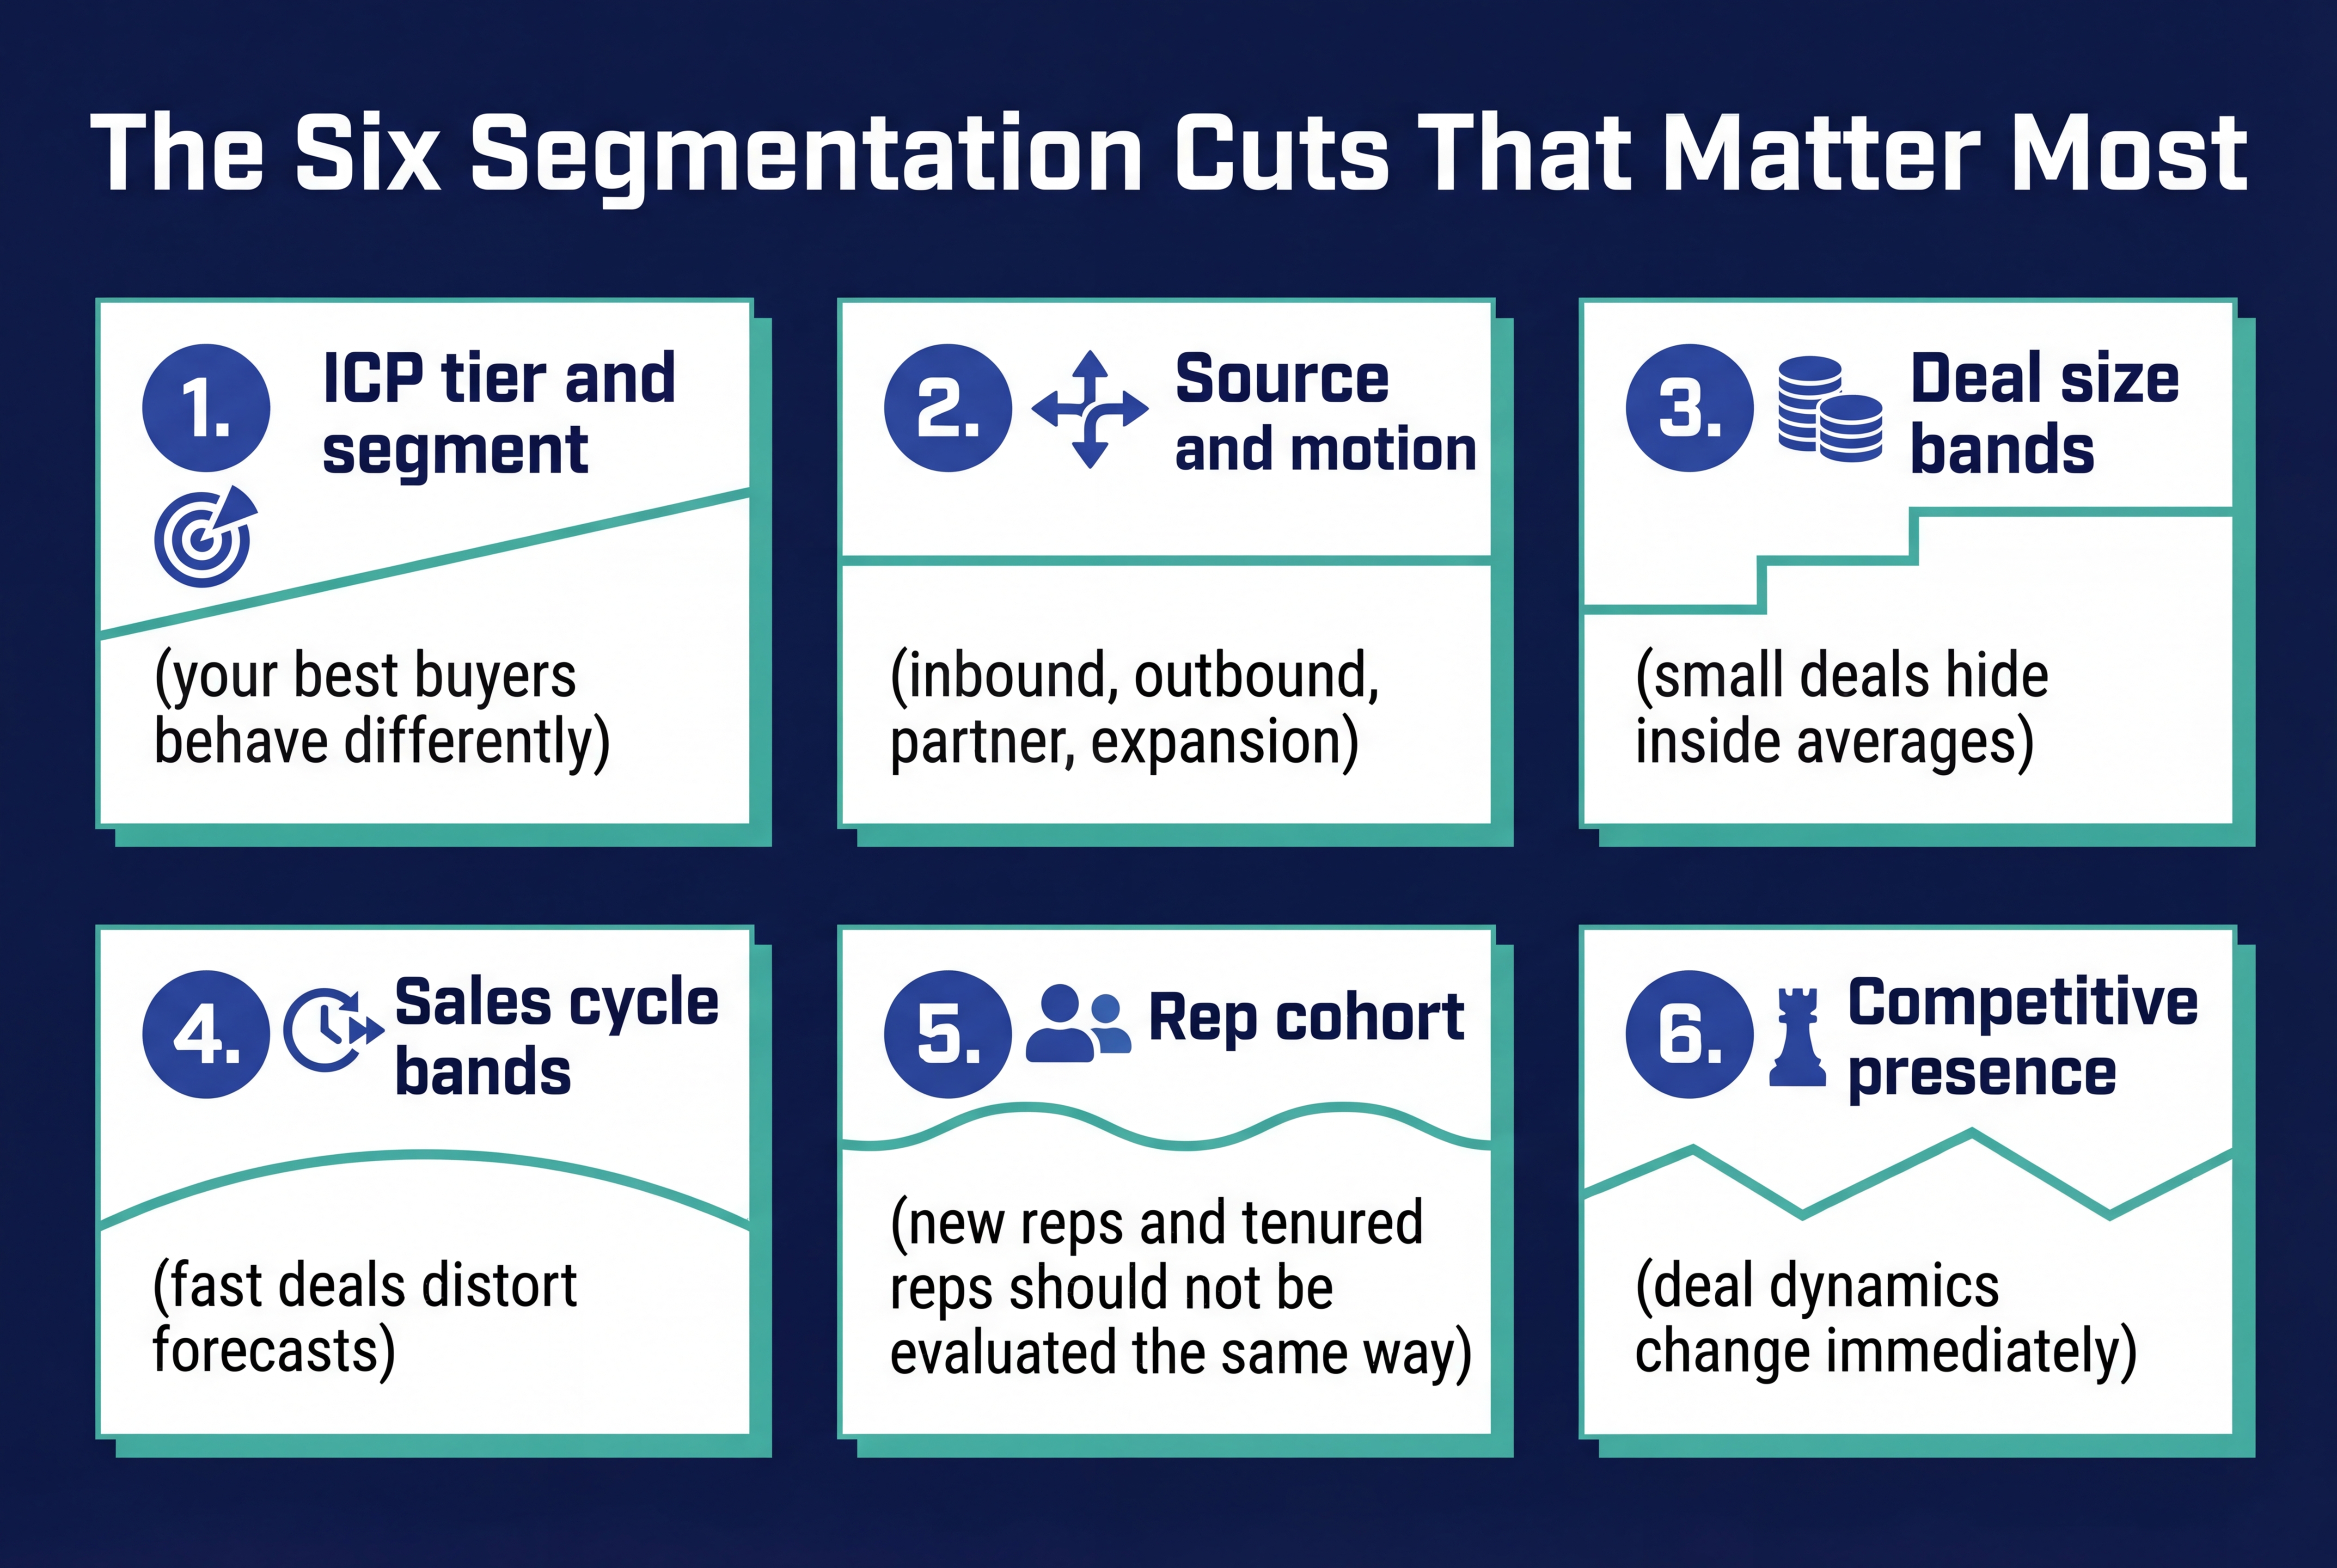
The Analytics Views That Make Problems Obvious
Most analytics failures are about perspective – a metric with no segmentation is a half-truth.
Leak Maps
A “leak map” is a simple way to see where revenue is bleeding.
- Map stage-to-stage conversion
- Add time-in-stage overlays
- Break it down by segment and motion
Suddenly you can see the truth:
- Stage 2 is not the problem. Stage 3 is where deals die.
- Inbound converts fine. Outbound is producing noise.
- Enterprise deals are stalling because stakeholder coverage is thin.
Not theory. Operational reality.
Deal-level Analytics For Coaching
Executives want dashboards. Managers need signals. The best coaching analytics is deal-level and specific.
Examples of signals that matter:
- Stage mismatch: Deal moved to a late stage without evidence
- Next-step weakness: No mutually agreed next step with a date
- Stakeholder gap: No budget owner engaged after X days
- Stall trigger: Time-in-stage exceeds the segment baseline
This is where analytics becomes coaching fuel.
Predictive Sales Analytics Without The Fantasy
Predictive sales analytics is useful. It also gets abused. Too many teams treat a probability score like a truth machine, then act surprised when reality disagrees.
What Predictive Sales Analytics Should Be Used For
Use prediction for:
- Forecast probability and risk scoring
- Slippage likelihood
- Pipeline creation pacing targets
- Segment-level conversion expectations
Avoid using prediction for:
- Excusing weak qualification
- Replacing manager judgment
- Pretending uncertainty does not exist
How Far Into The Future Can We Trust Predictions?
Prediction reliability drops as the horizon expands.
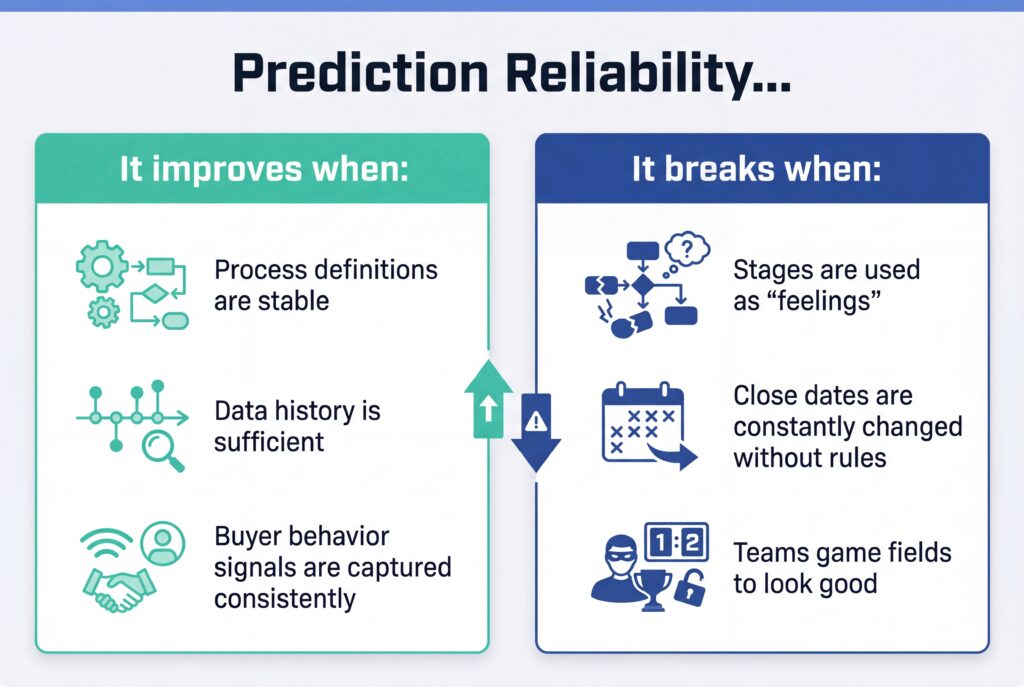
Prediction Hygiene Checklist
| Check | Why It Matters |
| Minimum data history by segment | One global model hides segment variance |
| Drift checks | Your motion changes. The model must notice |
| Clear override rules | Humans need a defined way to disagree |
| Audit trails | You need to explain decisions later |
| Calibration by segment | Enterprise and SMB cannot share the same assumptions |
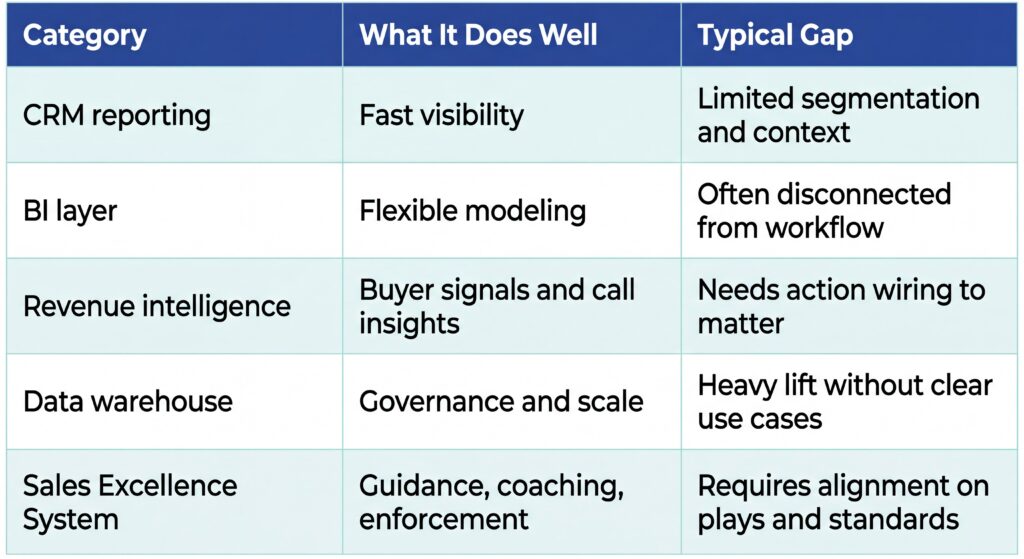
Sales Analytics Tools & Software
There is no shortage of sales analytics tools. The real shortage is adoption and operational clarity.
The Stack Categories
Best Sales Analytics Tools
Most sales analytics tools focus on visibility.
They help you see pipeline, activity, and outcomes more clearly.
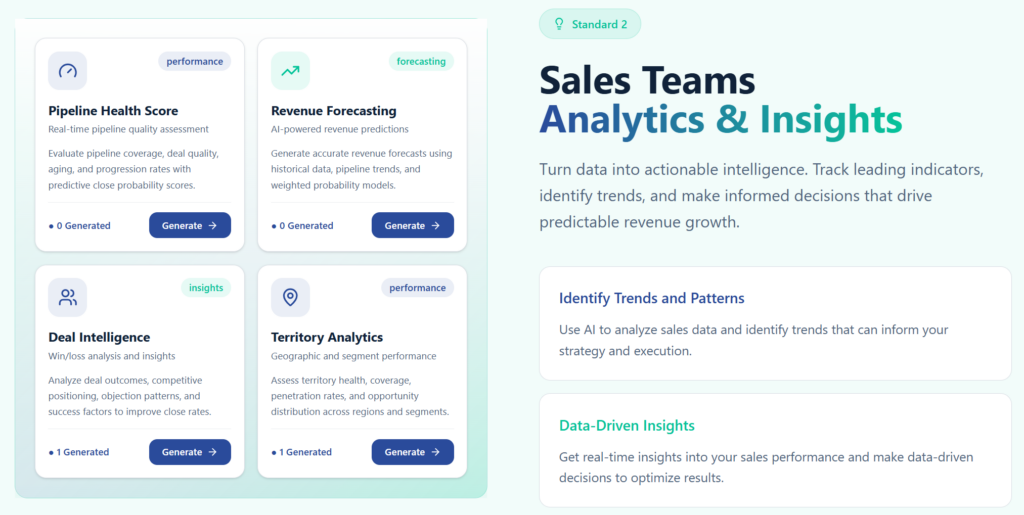
EnableU’s Sales Analytics & Insights pillar is built for what comes next: turning that visibility into actionable intelligence.
Instead of stopping at dashboards or reports, EnableU uses sales data to:
- Track leading indicators that signal deal risk, slippage, and execution gaps
- Identify patterns across pipeline, segments, and rep behavior that impact outcomes
- Surface insights directly inside sales and management workflows
- Support decisions around coaching, prioritization, and execution adjustments
For teams evaluating sales analytics software, EnableU fits when the requirement is not just better reporting – but a system that connects analytics to daily sales decisions and predictable revenue execution.
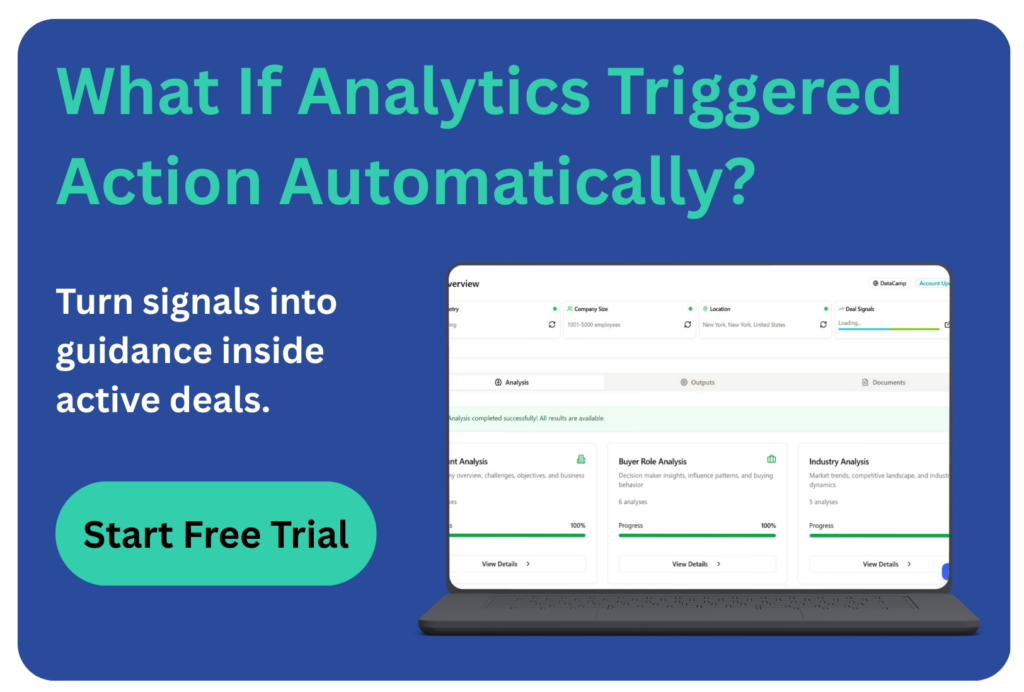
👉 Start a free trial and see how analytics supports better sales decisions day to day.
Operationalizing Sales Analytics
Sales analytics only compounds when it is tied to cadence.
No cadence, no change.
Cadences That Turn Analytics Into Execution
Weekly Pipeline Review (Team Level)
- Focus: risk, slippage, stage evidence, next steps
- Output: deal-level actions and owners
Weekly Manager Coaching (Rep Level)
- Focus: behaviors tied to leading indicators
- Output: one or two coaching priorities per rep
Monthly Performance Review (Leader Level)
- Focus: conversion, velocity, productivity by segment
- Output: changes to plays, enablement, and resourcing
Quarterly Planning (Exec Level)
- Focus: coverage, capacity, strategy shifts
- Output: territory, quota, and motion adjustments
Who Should Own What?
- CRO / VP Sales – decision integrity, forecast discipline, prioritization
- RevOps – definitions, governance, instrumentation, data trust
- Managers – coaching based on signals, not opinions
- Enablement – play updates, reinforcement, content in-use
Analytics fails when ownership is vague.
A 30–60–90 Day Implementation Plan
You can stand up meaningful sales analytics in 90 days if you stop trying to boil the ocean.
Start with decisions. Then instrumentation. Then cadence.

Days 0–30: Instrumentation & Definitions
Do these first:
- Lock stage entry and exit criteria
- Define “qualified” with teeth
- Set close-date rules and change tracking
- Build the metric tree and baseline
This is the boring part that makes everything else work.
Days 31–60: Dashboards & Manager Rhythm
Now wire analytics into how the org runs:
- Launch weekly pipeline review with standard signal checks
- Train managers on coaching using leading indicators
- Create 5 to 10 response plays tied to common risks
Example plays:
- Stakeholder gap play
- Next-step enforcement play
- Competitive risk play
- Stalled deal recovery play
Days 61–90: Predictive Layer & Experiments
Add prediction selectively.
Then run experiments.
- If we enforce next-step discipline, does time-in-stage improve?
- If we tighten qualification, does win rate lift even if pipeline shrinks?
This is where analytics becomes a growth engine.
Common Sales Analytics Pitfalls & How To Fix Them
You will hit these. Everyone does.
The difference is whether you treat them as normal operating problems or as reasons to give up.
| Pitfall | What It Looks Like | Fix |
| Metric sprawl | 50 charts, no decisions | Metric tree and role-based views |
| Data lies | “Green” deals that slip | Stage evidence rules and audit trails |
| Insights with no owner | Everyone agrees, nothing changes | Assign owner and response play |
| Tools outside workflow | Dashboards ignored | Bring guidance in-flow |
| Activity vanity | Lots of activity, low conversion | Quality-weighted leading indicators |
The pattern is consistent – sales analytics breaks when it becomes detached from execution.
Frequently Asked Questions
What is the difference between sales analytics and revenue analytics?
Sales analytics focuses on pipeline, deals, rep behavior, and execution quality. Revenue analytics is broader. It includes pricing, retention, expansion, and finance signals. Sales analytics feeds revenue analytics, but they are not interchangeable.
What sales analytics metrics matter most for CROs?
CROs should prioritize pipeline coverage, stage-to-stage conversion, time-in-stage, forecast accuracy, and win rate by segment. These metrics expose execution risk early and support better planning and coaching decisions.
How often should sales analytics be reviewed?
Leading indicators should be reviewed weekly in pipeline and coaching cadences. Outcome and trend metrics belong in monthly and quarterly reviews. If analytics only shows up in QBRs, it’s already too late.
Can small or early-stage teams benefit from sales analytics?
Yes, but the scope must be tight. Early teams should focus on qualification quality, cycle length, win reasons, and ICP fit. Lightweight analytics early prevents bad habits from scaling later.
Conclusion
Sales analytics only works when it stops being a reporting exercise and starts shaping how teams sell. That means clear definitions, a small set of metrics that matter, and a system that ties leading indicators to real decisions.
Pipeline health, conversion, velocity, productivity, and forecast trust are not abstract concepts. They are signals of whether execution is breaking down or holding together.
When analytics is grounded in behavior and reviewed through the right cadence, it becomes a lever for coaching, prioritization, and predictable growth.
If you want to see how sales analytics fits into a broader Sales Excellence System, start a free trial to experience how EnableU’s analytics and guidance pillars work together to surface risk early and drive better decisions while deals are still live.
Leave a Reply