
Revenue performance can shift quickly.
Sometimes it’s a market move.
Sometimes it’s internal drift.
Sometimes it’s simply growth outpacing structure.
Either way, when results wobble, leaders need a plan that goes beyond motivational resets and cosmetic fixes.
A sharp 100 day sales turnaround plan creates clarity, control, and forward momentum in a defined window.
We’ll break down how to diagnose root causes, rebuild the revenue engine, and restore predictable growth within 100 days.
Key Notes
- First 30 days focus on pipeline integrity, forecast truth, and inspection cadence.
- Structural fixes target ICP focus, stage discipline, pricing governance, and coverage design.
- Acceleration comes from improving win rates, cycle time, and margin control.
What a sales turnaround is (& what it is not)
A turnaround is a controlled reset of the revenue engine.
Not a rebrand. Not a new pitch deck. Not “sell harder.”
In portfolio reality, a sales turnaround has three jobs:
- Stop the bleeding. Restore truth, hygiene, and decision-making cadence.
- Fix the system. Coverage, roles, stages, incentives, and pricing governance.
- Prove traction. Early, measurable signs that the engine will produce outcomes.
What it is not:
- A pipeline generation sprint when conversion is broken.
- A comp plan rewrite when stage definitions are meaningless.
- A territory reshuffle when ICP focus is still fuzzy.
- A headcount cut because you are frustrated.
The fastest way to waste 100 days is to pull every lever at once.
You will lose comparability. You will lose morale. You will lose time.
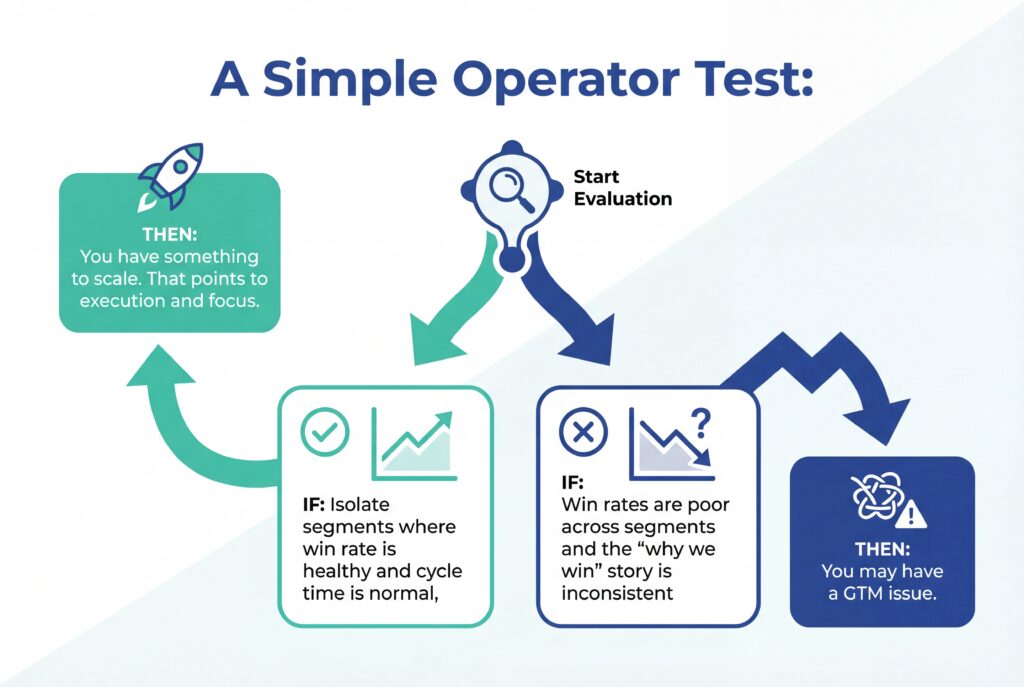
Sales problem vs GTM problem
Before you touch structure, you need the diagnostic split:
- Sales execution problem: demand exists, but conversion, velocity, and deal control are weak.
- GTM strategy problem: execution fixes do not move outcomes because the target, offer, or channel is wrong.
You do not need perfect certainty on day one.
But you need a disciplined fact base fast.
When to trigger a turnaround
Most turnarounds start late because lagging indicators show up when the quarter is already gone. You want the leading indicators that tell you the machine is breaking.
Early signals that matter
Look for these patterns.
One is a warning. Three is a trigger.
- Close date drift: the same deals move from this month to next month to “TBD.”
- Push count creep: deals get pushed multiple times without new proof.
- Time-in-stage inflation: stage duration increases while activity stays high.
- Stage 3 bloat: the middle stages become a parking lot.
- Pipeline “looks big but behaves small”: high dollar coverage, low conversion.
- Discounting as a strategy: approvals are loose, margins leak, pricing becomes inconsistent.
- NRR and GRR deterioration: retention economics are quietly making growth impossible.
These point to a single problem: you do not have a shared definition of deal reality.
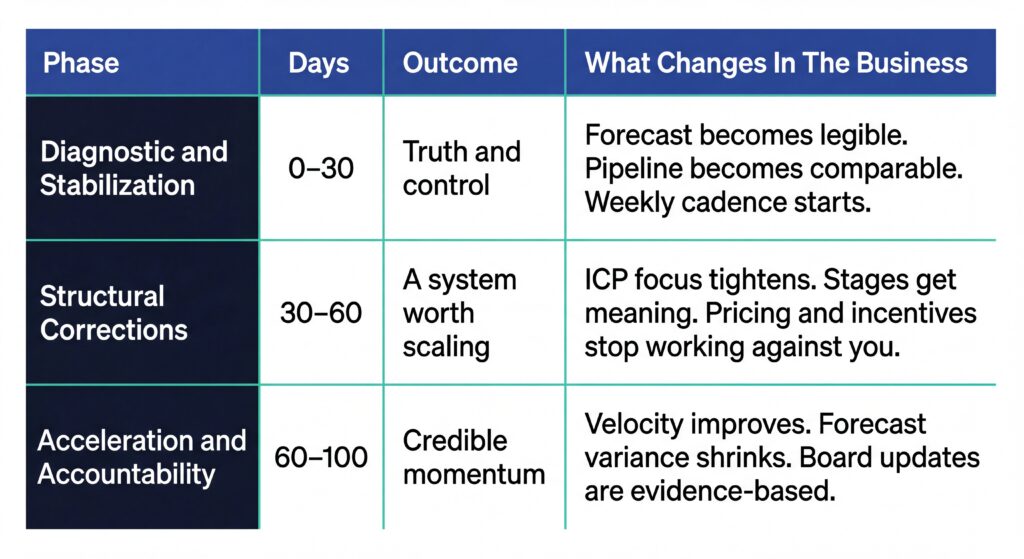
The 100-day framework at a glance
This is a three-phase plan:
Five non-negotiables
- One truth. Definitions, dashboards, and categories that everyone uses.
- Pipeline carries weight. Hygiene rules and qualification gates are enforced.
- Focus where you win. Segment decisions are made with evidence.
- Pricing and incentives enforce strategy. Discounting is governed.
- Cadence runs weekly. Inspection, coaching, and action tracking are not optional.
What not to change in the first 30 days
This is where good intentions create chaos.
- Do not overhaul territories, comp, CRM fields, and process in the same month.
- Do not “roll out a new methodology” while you still cannot define what stage 2 means.
- Do not buy tools to compensate for missing operating discipline.
First restore truth.
Then you earn the right to redesign.
Days 0–30: Build the fact base & stop the bleeding
Your first 30 days are about control.
If you do not create a clean fact base early, everything after that becomes negotiation.
The first five audits
Do these in order. Each one feeds the next.
1) Revenue reality audit
You need a clean bridge from pipeline to bookings.
- What did we book by segment, product, deal size, and channel?
- What was planned?
- Where did the shortfall come from: volume, conversion, cycle time, price realization, churn, or capacity?
This audit is not about blame.
You need to identify which constraint is dominant.
2) Pipeline integrity audit
Ignore total pipeline dollars for a moment. You are auditing “realness.”
Score deals using evidence, not stage labels.
Integrity signals to capture:
- Next step exists and is dated.
- Close date is supported by buyer behavior.
- Buying group is identified beyond a single champion.
- Economic buyer has engaged or has a defined path.
- Clear problem and impact exist in notes, not memory.
If you cannot find evidence in the CRM, the deal is not a deal. It is a hope file.
3) ICP and segmentation audit
Turnarounds fail when you try to win everywhere.
You need answers to two questions:
- Where do we win more than we lose?
- Where do we win without discounting the future?
Segment by what drives performance, not what looks neat:
- Industry
- Use case
- Buyer type
- Deal size band
- Channel
- Product mix
Your goal is not to pick the “ideal” segment.
It is to pick the segment you can execute in with the current team.
4) Sales process and qualification audit
Here, you’re evaluating whether stages mean anything.
- Do stage entry and exit criteria exist?
- Are they enforced by managers?
- Are they visible in the workflow?
5) Talent and operating cadence audit
Most revenue problems get blamed on reps, but the real culprit is weak management cadence.
Audit:
- Do managers run consistent inspection?
- Are pipeline reviews coaching moments or status meetings?
- Do leaders challenge assumptions using evidence?
- Is there a standard for what “commit” means?
If leaders cannot enforce cadence, no playbook will save you.
Minimum dataset required before structural changes
Pull these, even if it is messy.
- Opportunity fields: stage, amount, close date, created date, last activity, next step date, push count, segment tags, source.
- Historical win/loss: win rate, cycle time, deal size distribution by segment.
- Pipeline aging: time-in-stage by rep and by segment.
- Pricing and discount distribution: discount bands, approvals, margin impact.
- Retention economics where relevant: churn, expansion, NRR, GRR.
You are trying to answer one operator question: what is really driving underperformance?
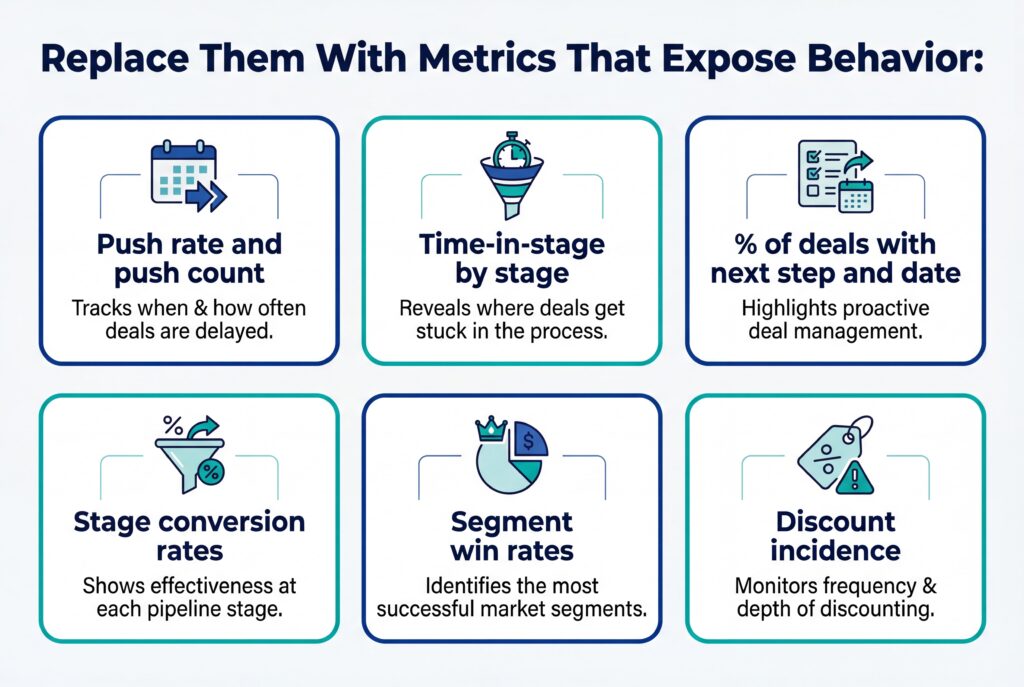
Metrics that lie during a turnaround
These numbers will mislead you in the first month:
- Total pipeline dollars
- Activity volume
- Weighted pipeline using stage probabilities
- Lead volume
Minimum viable forecast that restores credibility
Use simple categories with hard rules:
- Commit: evidence-based deals with next step dated and buyer path clear.
- Best case: plausible, but missing one key proof.
- Pipeline: real opportunities still being shaped.
- Closed: done.
Define “commit” once. Publish it. Enforce it.
Commit criteria example (short and strict):
- Close date reflects a buyer-driven milestone.
- Next step is scheduled.
- Economic path exists, even if the EB has not engaged.
- Clear problem and impact documented.
If a deal cannot meet this, it cannot be commit.
This is where credibility is rebuilt.
Practical assets for Days 0–30
You want tools that make discipline easy.
Opportunity hygiene rules (start simple):
- No close date without a dated next step.
- No more than two pushes without requalification.
- Stage aging thresholds trigger a review.
- Deals without recent activity get triaged.
First 30-day dashboard spec (minimum):
- Pipeline by stage and category.
- Aging report by stage.
- Push count distribution.
- Conversion by stage.
- Segment performance view.
This is enough to run the next phase.
Days 30–60: Structural corrections that move numbers
Now you have truth.
Now you can change things without guessing.
The temptation here is to redesign the org chart. Resist it.
Fix the commercial architecture first.
Start with focus: segmentation & ICP tightening
A turnaround requires a tactical ICP.
Your ICP decision should be based on evidence from the audits:
- Strongest win rates.
- Lowest discounting.
- Shortest cycle time.
- Highest retention and expansion.
You are choosing where the business can win in the next two quarters. That is the point.
Territory, role & coverage redesign
Coverage should follow how the customer buys.
The common failure mode is allocating coverage based on legacy territory maps or internal politics.
Your fix should align:
- Sales complexity: transactional vs complex.
- Buyer group: single-threaded vs committee.
- Channel motion: direct vs partner.
- Product motion: land-and-expand vs one-off.
Outputs you want by end of Day 60:
- A clear coverage map by segment.
- Defined handoffs between SDR, AE, and CS.
- Capacity assumptions tied to the plan math.
Sales process fixes with the fastest measurable lift
Stage control upgrades that move outcomes:
- Stage entry and exit criteria published.
- A “proof checklist” for progression.
- Deal kill criteria to stop ghost pipeline.
Managers need leverage.
Exit criteria is leverage.
Deal inspection mechanics
Most pipeline reviews are status meetings with a forecast spreadsheet.
In a turnaround, inspection needs to create behavior change.
Use two meeting types:
- Pipeline inspection: hygiene, next steps, aging, and qualification depth.
- Deal desk: high-risk deals, pricing exceptions, and late-stage strategy.
These are different jobs. Keep them separate.
Pricing & discount governance
Pricing is often the fastest lever in a PE context because it is immediate and measurable.
If discounting is loose, you have two hidden problems:
- You are buying revenue with margin.
- You are teaching the market that list price is not real.
Turnaround governance should be simple:
- Discount bands with approval thresholds.
- Deal desk required for exceptions.
- Standard guardrails for margin and term.
Quota resets without destroying morale
Quota resets are common in turnarounds.
They are also where you can lose the room.
If you reset quota, you must also show what changed in the system.
Use a clear math story:
- Capacity (active reps)
- Win rate by segment
- Average selling price
- Cycle time
If the plan assumes a win rate that the business has never achieved, call it out and fix the constraint instead of yelling at the field.
When headcount reductions are necessary
Cuts should be driven by:
- Pipeline sufficiency relative to capacity
- Unit economics
- Sales cycle reality
Cuts should not be driven by disappointment.
Overstaffing a broken process creates discount wars and forecast noise.
Understaffing a healthy segment creates missed upside.
This is why you needed the first 30 days.
Practical assets for Days 30–60
Stage exit criteria template (example structure):
- Required buyer proof
- Required internal proof
- Required next step
- Disqualifiers
Pricing governance one-pager:
- Discount bands and approvals
- Exception process
- Deal desk inputs
Quota reset narrative script (for CEO/CRO):
- What changed in the system
- What is expected from managers
- What is expected from reps
- What will be measured weekly
Days 60–100: Acceleration & accountability the board trusts
This is where you prove the turnaround is real.
Not with promises, but with leading indicators that hold.
What success by Day 100 looks like
This depends on sales cycle length.
- In SMB and transactional motions, you may see bookings lift within the window.
- In enterprise, Day 100 success is often pipeline integrity, improved stage progression, and credible next-quarter outcomes.
Either way, the board should see:
- Reduced forecast variance.
- Lower push rates.
- Cleaner stage conversion.
- Better segment focus.
The fastest levers that compound
Acceleration is not magic. It is math.
A simple velocity lens:
(Opportunities × ACV × Win Rate) ÷ Cycle Length
Your job is to improve the levers that are most broken.
Usually:
- Win rate: through qualification and deal strategy.
- Cycle length: by removing friction and enforcing next steps.
- Price realization: by controlling discounting.
Volume comes later. It is expensive when conversion is weak.
Enablement that moves the needle
Turnaround enablement is not a content library.
It is a small set of tools that makes good execution repeatable:
- Qualification scripts and question paths.
- Objection talk tracks tied to segment reality.
- Deal review checklists that managers use.
- Multi-threading maps for buying groups.
Enablement only counts if it shows up in calls, notes, and deals.
The cadence stack: your weekly operating system
This is where many turnarounds quietly die.
Cadence fades when the first fires calm down.
Do not let that happen.
Weekly cadence stack (minimum):
- Rep to manager pipeline inspection.
- Manager forecast roll-up with commit proof.
- Deal desk for exceptions and late-stage risk.
- Segment performance review monthly.
The cadence is what creates accountability without drama.
Day 100 Scoreboard
By Day 100, you should be able to show a scoreboard that is legible and non-negotiable.
Include both leading and lagging indicators.

If these are improving, the turnaround is real.
The finance layer: make the turnaround survivable & finance-legible
Cost control with targeted growth investments
In a stressed business, you must protect a few investments that convert.
Typically worth protecting:
- Pricing discipline and deal desk.
- Minimum RevOps capability to maintain truth.
- Enablement that is used in the workflow.
Typically worth pausing:
- Broad tool expansion.
- Large top-of-funnel spend when conversion is broken.
When marketing spend makes sense
A simple rule:
- If qualified opportunity creation is the constraint, invest.
- If pipeline integrity and conversion are the constraint, fix execution first.
Marketing into a broken funnel produces noise. It does not produce revenue.
Revised forecasting during a turnaround
Forecasting should be tied to observed behavior.
Use:
- Standard forecast categories.
- Coverage ratios tied to real historical win rates.
- Segment-specific assumptions.
If you are SaaS, incorporate churn and expansion into the model early.
Otherwise you can hit bookings and still miss net revenue.
CRO & CFO alignment
The fastest way to undermine a turnaround is to let the CFO and CRO live in different realities.
Align on:
- Definitions.
- Dashboards.
- Cadence.
One truth. Always.
Talent & change dynamics: keep the team, fix the system
Turnarounds break teams when they feel arbitrary.
Discipline is not the problem.
Unfairness is.
What turnaround-capable leadership looks like
- Enforces stage integrity.
- Challenges assumptions with evidence.
- Coaches in the moment.
- Protects focus.
- Makes decisions visible.
Assess rep quality fast
You do not need to wait for quarters to see who is serious.
Look for:
- Hygiene discipline.
- Coachability.
- Qualification depth.
- Next-step control.
- Segment focus.
Reps who thrive in a turnaround tend to like clarity.
Reps who rely on chaos tend to struggle.
Morale traps to avoid
- Changing the rules weekly.
- Public shaming as “accountability.”
- Forcing activity without fixing conversion.
- Announcing big transformations with no operational proof.
One small visible improvement in two weeks beats a big speech.
Engineering short-term wins
Turnarounds need early wins, but not fake wins.
Good early wins:
- Forecast categories enforced and respected.
- Pipeline cleaned without losing momentum.
- Discount governance reduces margin leakage.
- One segment focus produces improved win rates.
These create belief. Belief creates execution.
Advanced scenarios: adjust the plan without breaking it
The framework holds.
The emphasis shifts.
Enterprise vs SMB
- SMB: bookings can improve quickly if hygiene and qualification tighten.
- Enterprise: the first proof is pipeline integrity and stage progression.
Do not promise Day 100 bookings in a long cycle unless you have leading indicators to justify it.
SaaS vs services
- SaaS: retention economics must be first-class. Churn can erase growth.
- Services: pipeline must align with delivery capacity or you will create a different kind of fire.
Churn-heavy vs retention-strong businesses
- If churn is high, you may need a parallel customer success intervention.
- If retention is strong but growth is flat, acquisition and coverage execution are more likely the constraint.
AI in a turnaround
Use AI tactically. Not as a distraction.
Useful:
- Automating hygiene prompts.
- Surfacing deal risk signals.
- In-call coaching cues.
- Standardizing manager prep.
Not useful:
- Buying “AI platforms” to avoid fixing stage integrity.
- Replacing coaching with generated text.
AI amplifies the system you have. It does not replace one.
How Do you know the turnaround is failing?
This is where operators earn their keep.
You need to know when to re-open the diagnostic.
Failure signals
- Forecast variance does not improve after definitions and cadence are enforced.
- Push rates remain high and time-in-stage continues to inflate.
- Stage conversion does not improve, even with inspection and coaching.
- Leadership cannot hold the operating rhythm.
- Retention continues to decay with no clear plan.
What to re-check first
Use a clean decision order:
- GTM vs sales problem split: are you selling the right thing to the right buyer?
- Leadership enforcement: do managers actually run the system?
- Segment focus: are you trying to win everywhere?
- Pricing and incentives: are you rewarding the wrong behavior?
Do not add more initiatives.
Remove ambiguity.
How EnableU Helps in a 100 Day Sales Turnaround
A 100 day sales turnaround plan needs structure. Not more meetings.
EnableU is the planning layer PE operators use to design and control the reset.
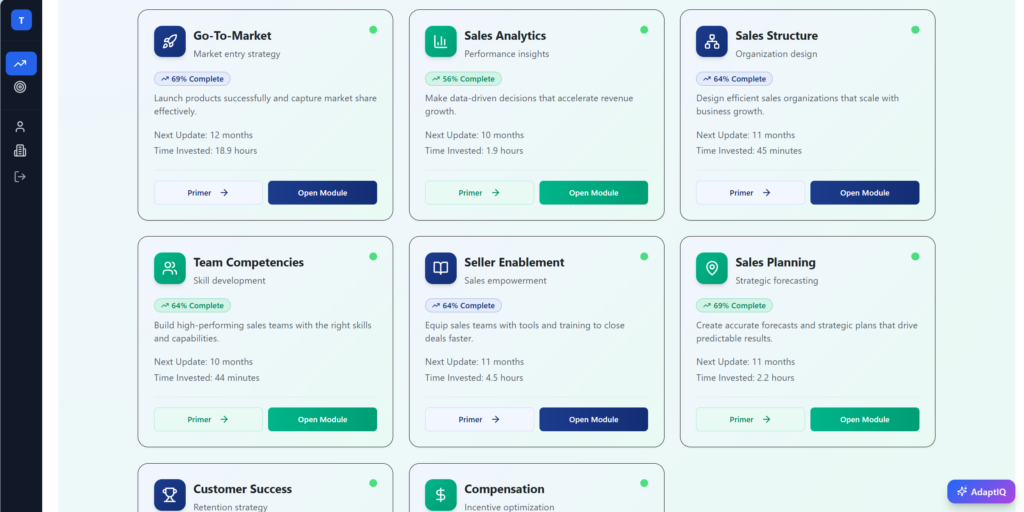
Turn the Turnaround Into 8 Clear Workstreams
Instead of scattered fixes, structure it across:
- GTM
- Forecast & Pipeline
- Structure
- Talent
- Planning
- Compensation
👉 Start a free trial to turn your 100 day sales turnaround plan into a structured, measurable system.
Frequently Asked Questions
What is a 100-day plan in private equity?
A 100-day plan in private equity is a structured action roadmap executed immediately after investment or leadership change. In a sales context, it focuses on stabilizing revenue performance, restoring forecast credibility, and installing operating discipline that drives measurable growth within the first quarter.
How long does a sales turnaround typically take?
A true sales turnaround usually takes 6–12 months for full financial impact, depending on sales cycle length. However, leading indicators like forecast accuracy, pipeline integrity, and stage conversion should improve within the first 30–100 days if the plan is working.
What are the most common causes of sales underperformance in PE-backed companies?
The most common causes are weak pipeline discipline, unclear ICP focus, misaligned incentives, and inconsistent management cadence. In many cases, the issue is execution drift rather than market demand or product-market fit.
What metrics should be included in a sales turnaround dashboard?
A strong sales turnaround dashboard includes push rate, time-in-stage, stage conversion, win rate by segment, discount incidence, and forecast variance. For SaaS businesses, add churn, expansion, and net revenue retention to ensure growth is durable – not just booked.
Conclusion
A strong 100 day sales turnaround plan is disciplined.
The first 30 days restore truth. The next 30 fix structure based on evidence. The final stretch proves momentum through cleaner stage progression, tighter forecast control, and pricing discipline that protects margin.
Turnarounds succeed when leaders enforce one version of reality, narrow focus to segments that convert, and build a weekly cadence that doesn’t fade once the pressure drops.
Speed comes from clarity. Clarity comes from structure.
Start a free trial of the Sales Excellence Platform to map your turnaround across the eight standards and pressure-test your plan against real data before you implement it.
Leave a Reply